
 English
 Bahasa Indonesia
 Tiếng Việt
 Español
 Français
 Deutsch
 العربية
 Português
SMT Divergence: How to Read and Trade Smart Money Divergence
SMT divergence appears when two correlated markets stop moving in sync, a footprint of smart money that often warns of a reversal. Here's how to read and trade it.
 Theo ToussaintHead of Trading
SMT divergence (Smart Money Technique divergence) is a price-action signal that appears when two closely correlated markets stop moving in sync, when one makes a new high or low that the other fails to confirm. That mismatch is a footprint of institutional (“smart money”) activity and often warns that the current move is running out of strength before a reversal.
In plain terms: correlated instruments should mirror each other. When they don't, the disagreement is the signal. Traders use SMT divergence to time entries around liquidity sweeps, spot false breakouts, and confirm reversals with more precision than a single chart allows.
Key takeaways
- What is SMT in trading? SMT stands for Smart Money Technique, a concept popularised in ICT (Inner Circle Trader) methodology that reads institutional behaviour through price.
- SMT meaning in trading: comparing two or more correlated assets to detect when they diverge, revealing hidden strength or weakness.
- A bullish SMT forms at lows; a bearish SMT forms at highs.
- SMT divergence is a confluence tool, not a standalone system, and it works best with liquidity, market structure, and order blocks.
What is SMT in trading?
SMT is short for Smart Money Technique. The idea is simple: banks, funds, and other large institutions leave measurable footprints in price, and by comparing markets that normally move together you can see those footprints more clearly than on any single chart.
Because major institutions trade correlated markets simultaneously (for example, several USD pairs, or the S&P 500 and Nasdaq futures), those markets tend to make highs and lows at the same time. When one instrument pushes to a new extreme and its correlated partner refuses to follow, that divergence suggests the move lacks broad institutional support, and a turn may be near. To go deeper on the surrounding framework, see our guide to smart money concepts terms.
SMT divergence meaning: how it works
SMT divergence relies on correlation between instruments. There are two kinds:
- Positive correlation: the instruments usually move in the same direction (e.g. EUR/USD and GBP/USD). You look for one to make a higher high or lower low that the other does not match.
- Negative correlation: the instruments usually move in opposite directions (e.g. EUR/USD and the US Dollar Index, DXY). Here they should mirror each other, so SMT appears when that mirror breaks.
Commonly correlated instruments for SMT
| Market group | Instruments | Correlation |
| Forex majors | EUR/USD & GBP/USD | Positive |
| Forex vs USD index | EUR/USD & DXY | Negative |
| Safe-haven pairs | EUR/USD & USD/CHF | Negative |
| US indices | S&P 500 (ES), Nasdaq (NQ), Dow (YM) | Positive |
| Metals | Gold (XAU/USD) & Silver (XAG/USD) | Positive |
Bullish vs bearish SMT divergence
Bearish SMT divergence (forms at highs)
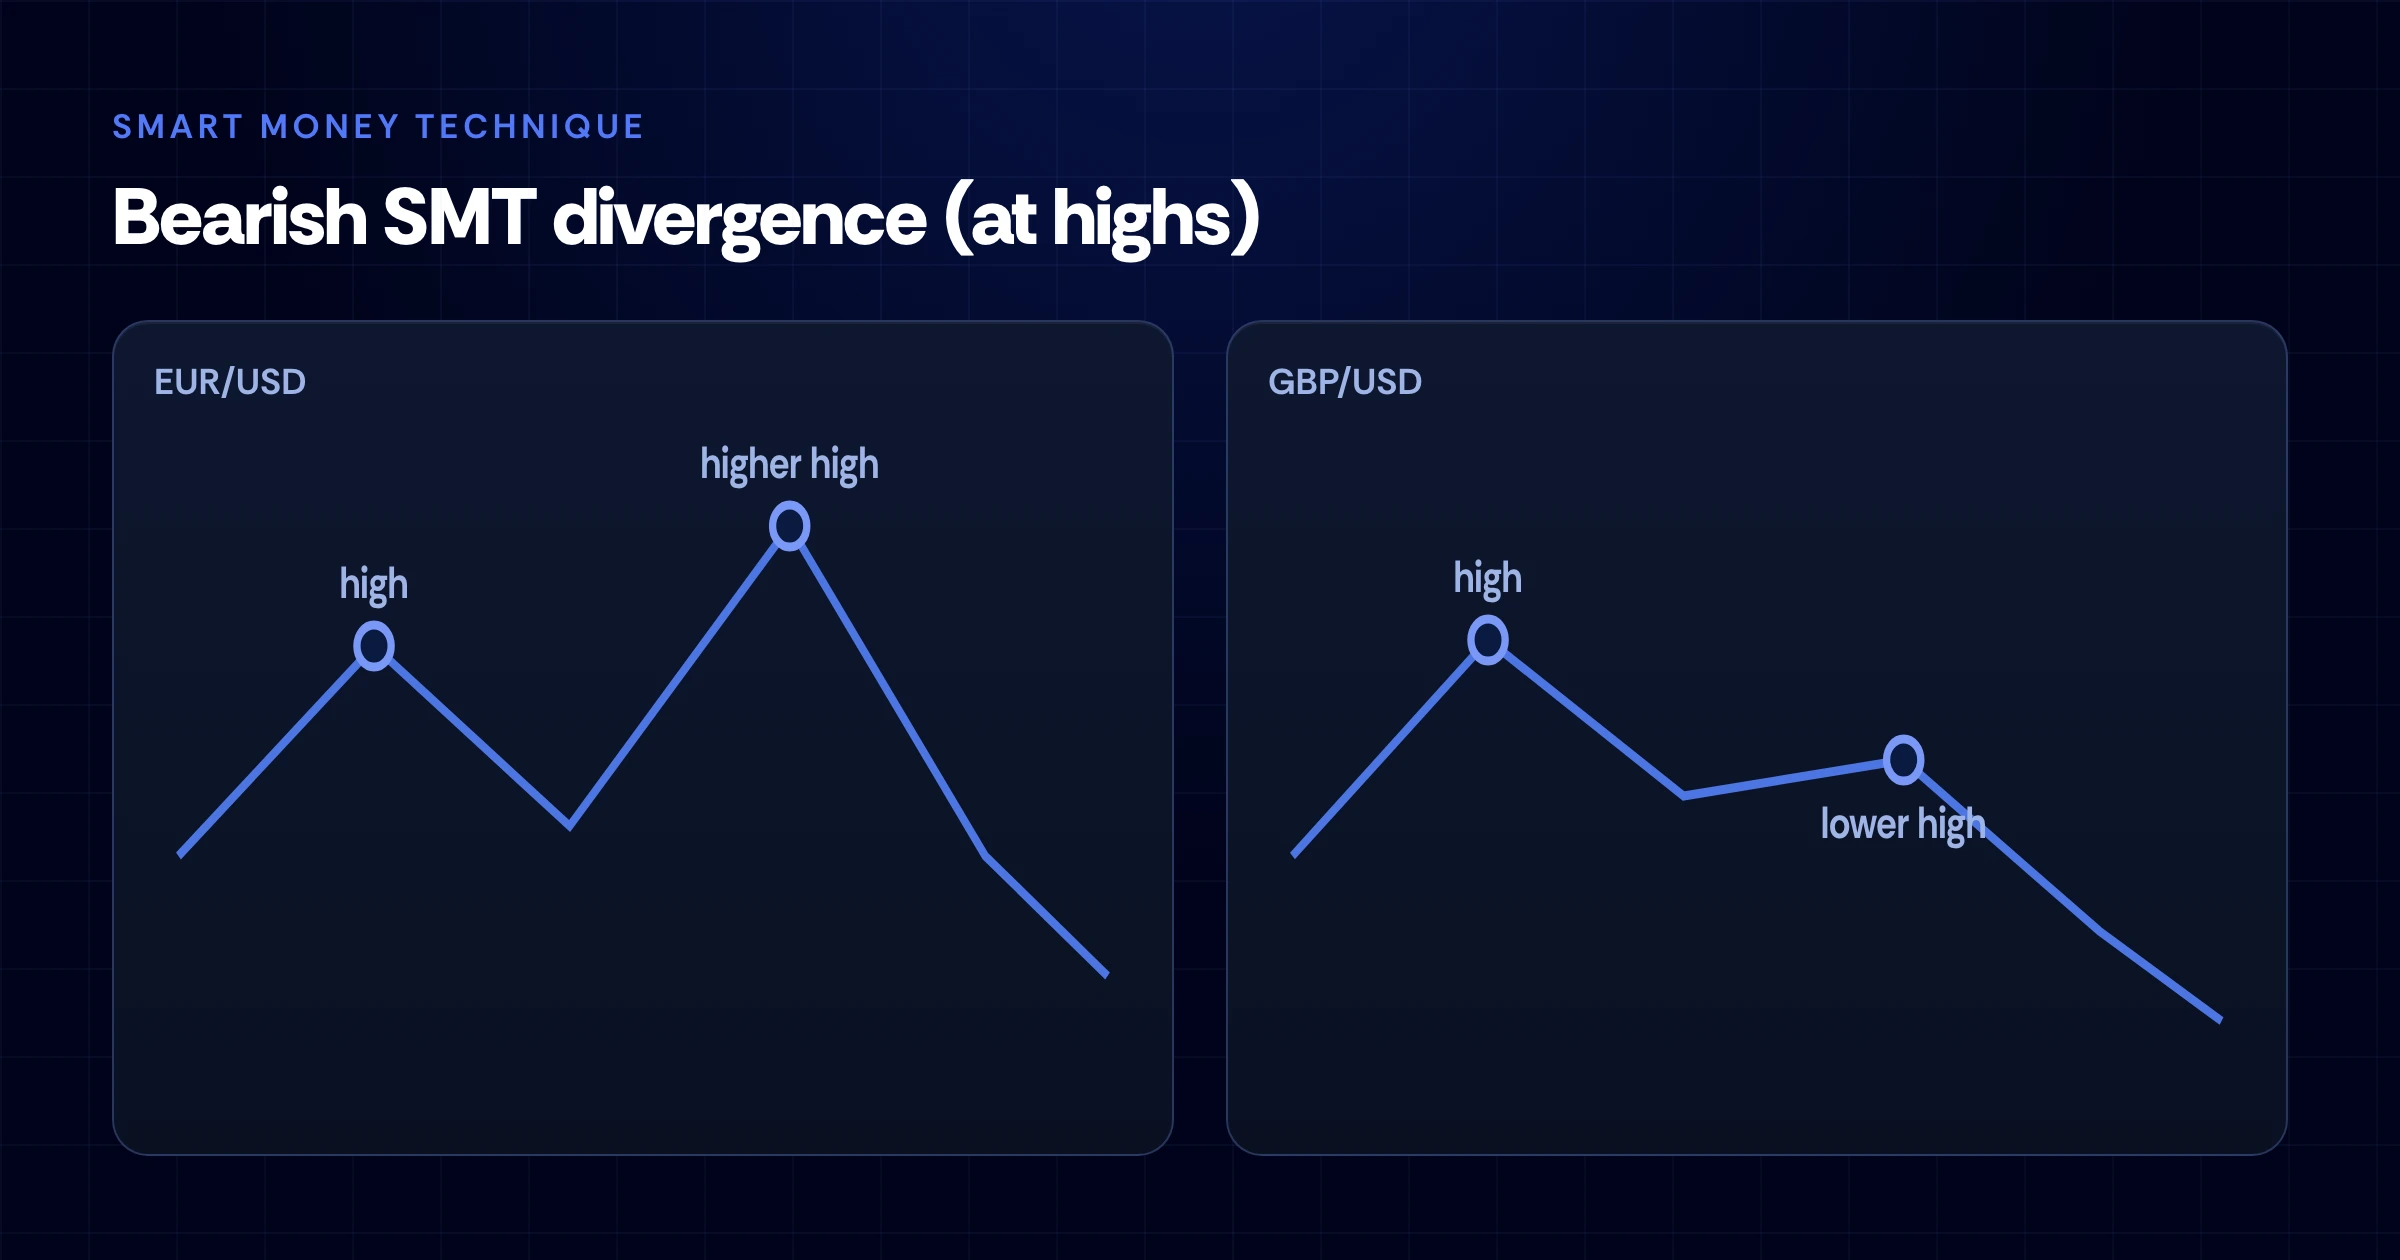
At a swing high in two positively correlated markets, instrument A makes a higher high while instrument B makes a lower high. Instrument B is showing relative weakness, because the smart money is not supporting the new high, and this often precedes a downside reversal, especially after a liquidity grab above the prior high.
Bullish SMT divergence (forms at lows)
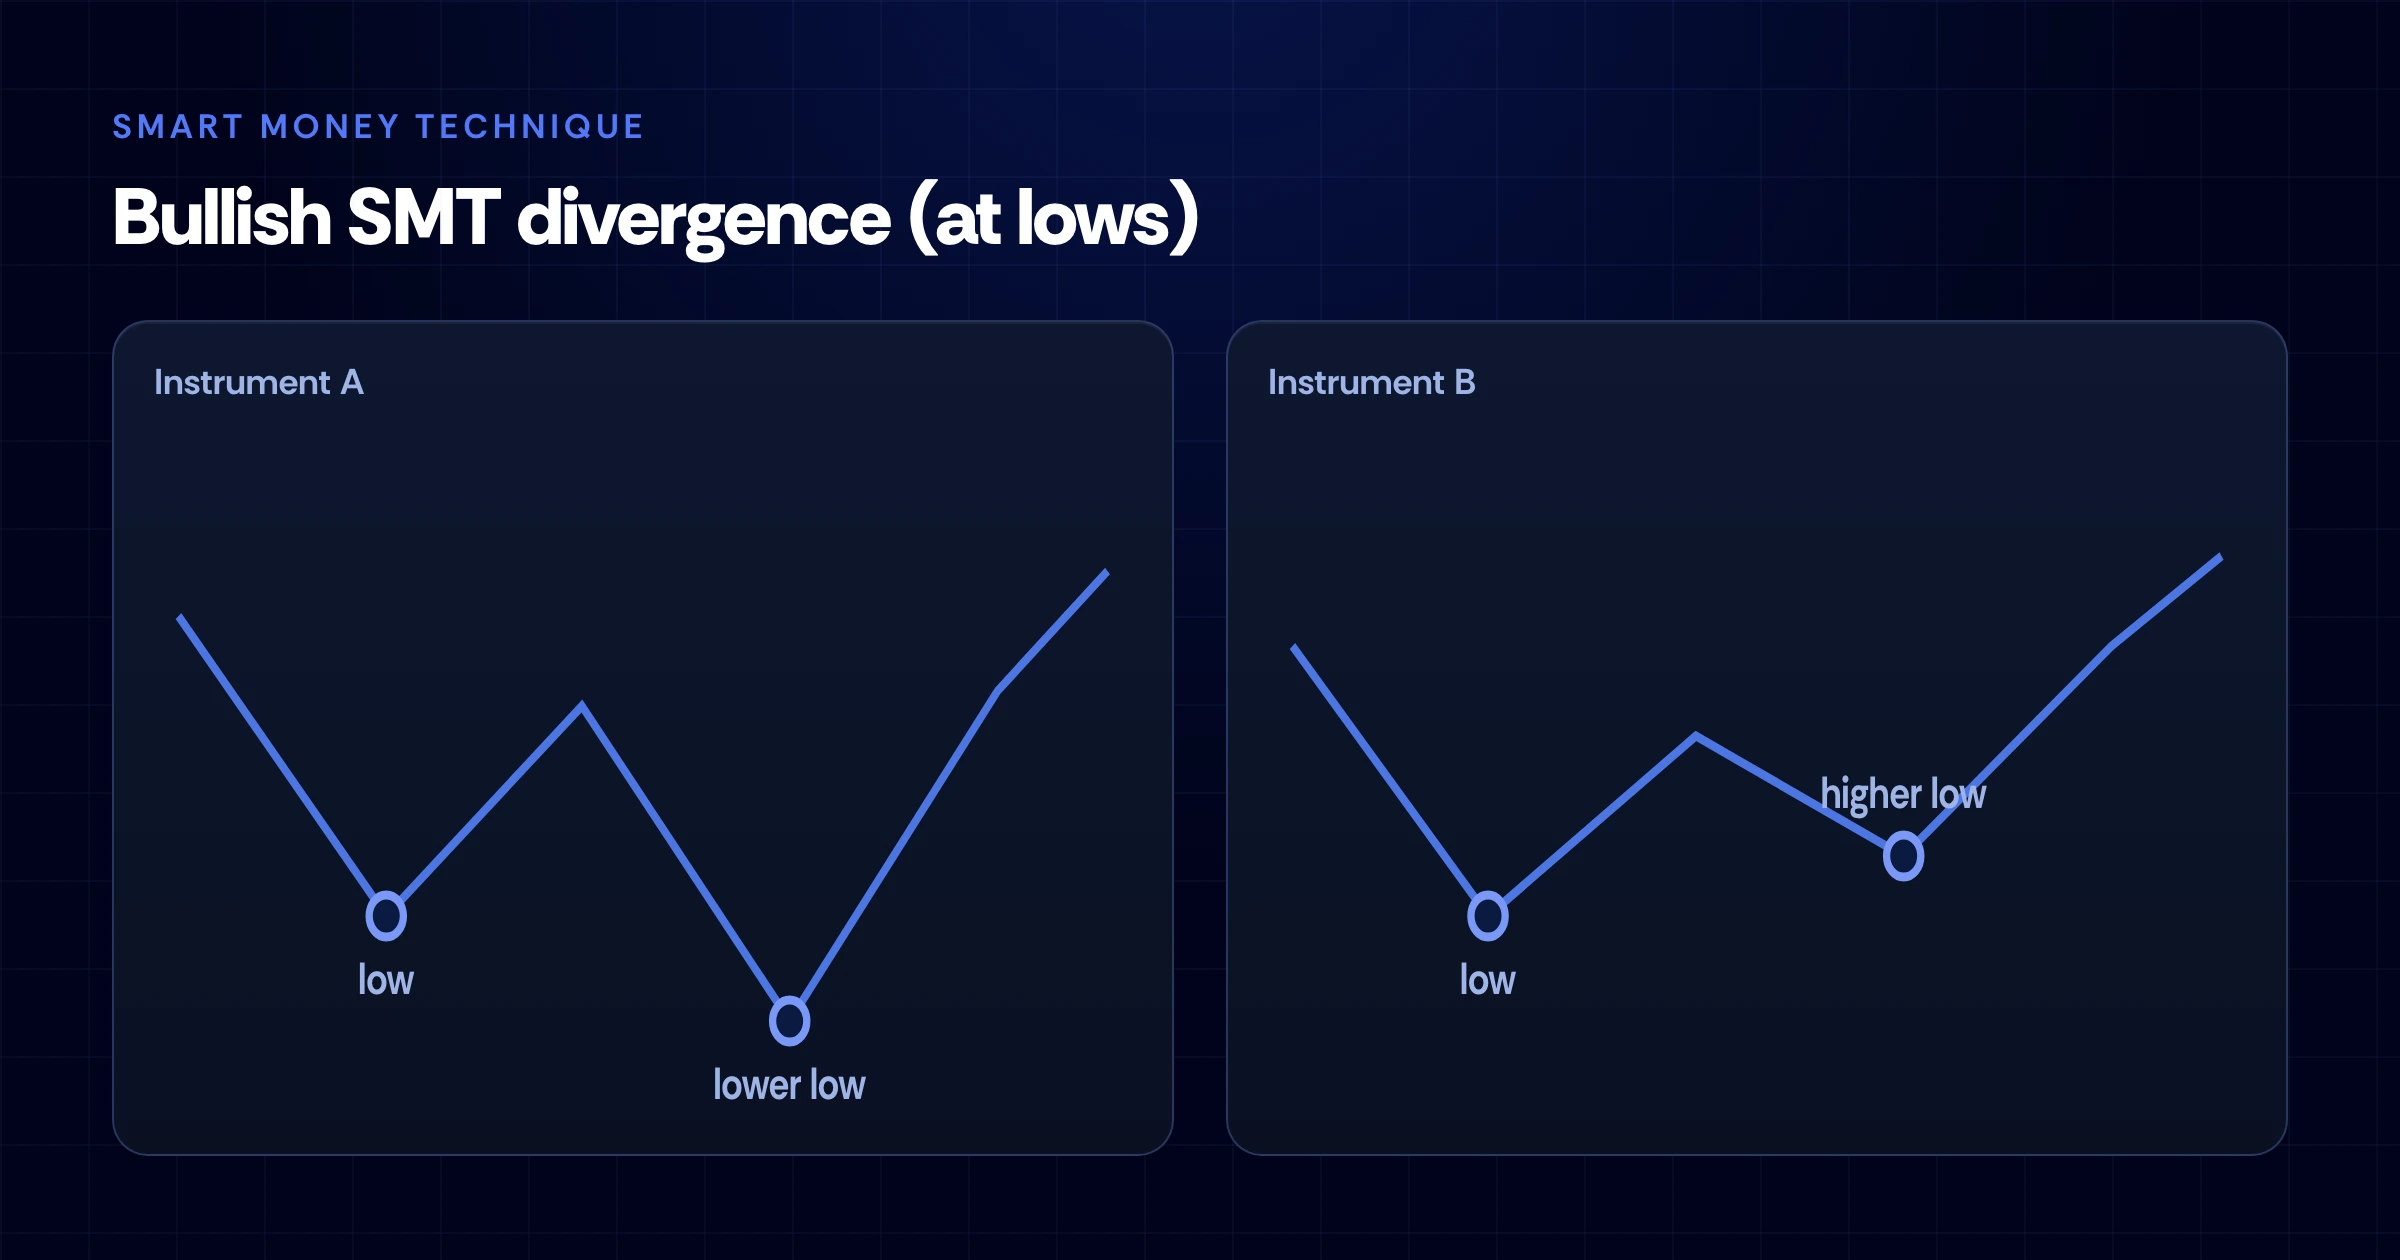
At a swing low, instrument A makes a lower low while instrument B holds a higher low. Instrument B is refusing to confirm the new low, signalling relative strength and a potential upside reversal, frequently after a sweep of sell-side liquidity below a prior low.
SMT divergence is a close cousin of indicator-based divergence. If you're comfortable reading RSI divergence or MACD divergence, SMT applies the same “price says one thing, momentum says another” logic, but across correlated markets instead of an oscillator.
How to trade SMT divergence: step by step
- Pick two correlated instruments and note whether they're positively or negatively correlated.
- Mark recent swing highs and lows on both charts using the same timeframe.
- Wait for a liquidity sweep, a push beyond an obvious prior high or low where stops sit. Read more on liquidity in forex.
- Check for divergence at that extreme: does one market make a new high/low the other fails to match?
- Confirm with market structure, such as a shift in structure (e.g. a lower-timeframe break of structure) after the sweep.
- Refine the entry using an order block or fair value gap, with your stop beyond the swept liquidity.
- Define risk first. Set your stop and position size before entering, and target the next opposing liquidity pool or key support and resistance level.
SMT divergence with confluence
On its own, an SMT reading is just a clue. It becomes a high-probability setup when it lines up with:
- Liquidity sweeps: divergence right after stops are taken is the strongest version.
- Market structure shifts: divergence plus a break of structure confirms intent.
- Order blocks or fair value gaps: precise entry zones that tighten risk.
- Session timing: SMT around the London and New York opens tends to be cleaner because that is when institutional volume is highest.
Common SMT divergence mistakes
- Comparing uncorrelated markets: the whole technique depends on genuine correlation, so verify it first.
- Ignoring the correlation type: for negatively correlated pairs, divergence looks different (a broken mirror, not a mismatched extreme).
- Trading SMT alone: without a liquidity sweep or structure shift, divergence often just means one market is temporarily lagging.
- Skipping risk management: no signal is worth trading without a predefined stop and position size.
How to set up SMT divergence on TradingView
Open two correlated symbols in a side-by-side layout (for example, EUR/USD and GBP/USD), sync the timeframe and crosshair, and use horizontal rays to mark matching swing highs and lows. When one chart prints an extreme the other doesn't, you've found SMT. FundYourFX accounts include advanced charting via TradingView-powered feeds, so you can practise reading SMT on live, market-derived prices.
Practise SMT divergence on a funded account
SMT divergence rewards screen time. Rather than risk your own capital while you learn to read it, you can develop the skill in a simulated, funded environment. With FundYourFX Instant Funding, you trade in a simulated account with real market data (no evaluation and no consistency rules), and if the strategy proves consistent, it becomes a repeatable edge you can scale. If you're preparing for an evaluation, our guide on how to pass a prop firm challenge pairs well with this setup.
Conclusion
SMT divergence turns correlation into information. By watching whether related markets confirm each other's highs and lows, you can anticipate reversals that a single chart would hide, especially when the divergence lands on a liquidity sweep with a clean structure shift. Treat it as a confluence tool, define your risk before every entry, and build the pattern-recognition through repetition on a simulated account.
Frequently asked questions
What does SMT mean in trading?
SMT stands for Smart Money Technique. It's a method of reading institutional activity by comparing correlated markets to see when they stop moving in sync.
What is SMT divergence?
SMT divergence occurs when two correlated instruments disagree at a swing point, where one makes a new high or low that the other fails to confirm, signalling a potential reversal.
Is SMT divergence reliable?
It's most reliable as part of a confluence-based approach. Divergence combined with a liquidity sweep and a market-structure shift is far more dependable than divergence read in isolation.
Which pairs are best for SMT divergence?
Strongly correlated groups such as EUR/USD and GBP/USD, EUR/USD and DXY (inverse), or the US index futures ES, NQ and YM are the most popular choices.
What timeframe works best for SMT?
SMT appears on every timeframe, but many traders find the cleanest signals around the London and New York session opens on 5-minute to 1-hour charts, aligned with a higher-timeframe bias.